MapleCub Data Lab · Province data · 2026
How many licensed daycares are in Ontario?
The country’s biggest child-care sector files the thinnest public record of itself, and in Ontario those two facts are the same fact.
- Computed 2026-08-10
- N = 4,374 Ontario programs
- 20,516 across eight registries
- CC BY 4.0
4,374
licensed programs
6.1
per 1,000 children aged 0–4
555
communities with licensed care
48.8%
of them have exactly one option
The short answer, with everything behind it
As of 2026-08-10, MapleCub counts 4,374 licensed child-care programs in Ontario — 4,209 centres and 165 licensed family homes. That is 6.1 licensed programs for every 1,000 of the province’s 720,586 children aged 0–4, the lowest rate of the eight provinces that publish a licensing registry. They sit in 555 communities; 271 of those (48.8%) have exactly one licensed program and no second choice, while 34% of the province’s licensed programs are in its five largest cities.
Ontario does not publish licensed capacity as open data, so how many children those programs can actually take cannot be worked out from public files. Ontario’s 2026 price position: $22/day cap. CWELCC fee cap of $22/day, in force since January 1, 2025. Separately, the one-year federal extension holds the provincial average at $19/day until December 31, 2026 and runs the agreement to March 31, 2027. The cap and the average come from two different commitments, and neither is $10/day. Which individual programs offer that price is not distinguishable from public registry data (no CWELCC enrolment field in the open data), so every row in the file carries the same value.3,1,2
On inspections, Ontario publishes confirmed violations and offences only: compliance orders, protection orders, administrative penalties, restraining orders and prosecutions. A routine Ontario inspection that ends in compliance is never published, and the provincial file of assessment results is withheld. A routine Ontario inspection that ends in compliance is never published, so a clean registry entry and an uninspected centre look identical from outside. Online, MapleCub has matched 1,996 of Ontario's 4,374 programs to a Google place record (45.6%), and 1,995 of those (99.9%) carry a rating, averaging 4.46 across 49,747 parent reviews. 2,999 programs (68.6%) have a website recorded in the frozen quarterly snapshot. Read the rating figure as coverage, not as visibility: with only 45.6% of Ontario matched, the share of the province that actually carries a rating could be anything from 47.4% to 101.8%, so this page draws no conclusion about Ontario's sector from it.3,4
Source: MapleCub Canadian Childcare Dataset — Aug 2026 · computed 2026-08-10 · N = 4,374 · CSV · Ontario; visible listings only
The numbers
| Measure | Value | What it means |
|---|---|---|
| Licensed programs | 4,374 | 21.3% of the 20,516 licensed programs across the eight provinces that publish registries. |
| Centres | 4,209 | 96.2% of the province’s licensed programs. |
| Licensed family homes | 165 | 3.8% of the province’s licensed programs. Whether homes appear at all is a licensing rule, not a measure of how much home care exists. |
| Children aged 0–4 | 720,586 | Statistics Canada, Table 17-10-0005-01 (July 1, 2025 estimates)8 |
| Programs per 1,000 children | 6.1 | Licensed points of access a parent can look up, not licensed spaces. Registries differ in what they record, so read it alongside the provider mix above. |
| Communities with licensed care | 555 | A community is a normalized city name (lower-cased and trimmed) so registry case variants do not count twice. |
| Communities with exactly one option | 271 (48.8%) | One licence serves the whole community: no comparing, no waitlist hedging, no second choice. |
| Share in the five largest cities | 34% | How concentrated the province’s licensed supply is in its biggest municipal markets. |
| Published licensed capacity | Not published as open data | The province publishes a program list without saying how many children each program may serve, so no space count can be derived from public files. |
| Inspection records | Per facility only | Published on each facility’s own page, never as a bulk dataset, so no province-wide question can be answered from them.3,4 |
| Programs with a website | 2,999 (68.6%) | Harvested conservatively, requiring name agreement, so this undercounts rather than overcounts. |
| Matched by MapleCub to a Google place | 1,996 (45.6%) | Below the 60% floor this Lab requires before it will say anything about a province's own visibility, so the rating figure below is read as our coverage rather than as Ontario's. |
| Rated among the matched | 1,995 of 1,996 (99.9%) | Average 4.46 out of five across 49,747 parent reviews. Across ALL of Ontario's listings the rated share is 47.4%: a floor set by our matching, and a ceiling of 101.8% if every listing we never matched turned out to be rated. |
Source: MapleCub Canadian Childcare Dataset — Aug 2026 · computed 2026-08-10 · N = 4,374 · CSV · child population: Statistics Canada, Table 17-10-0005-01 (July 1, 2025 estimates)
How Ontario compares on supply
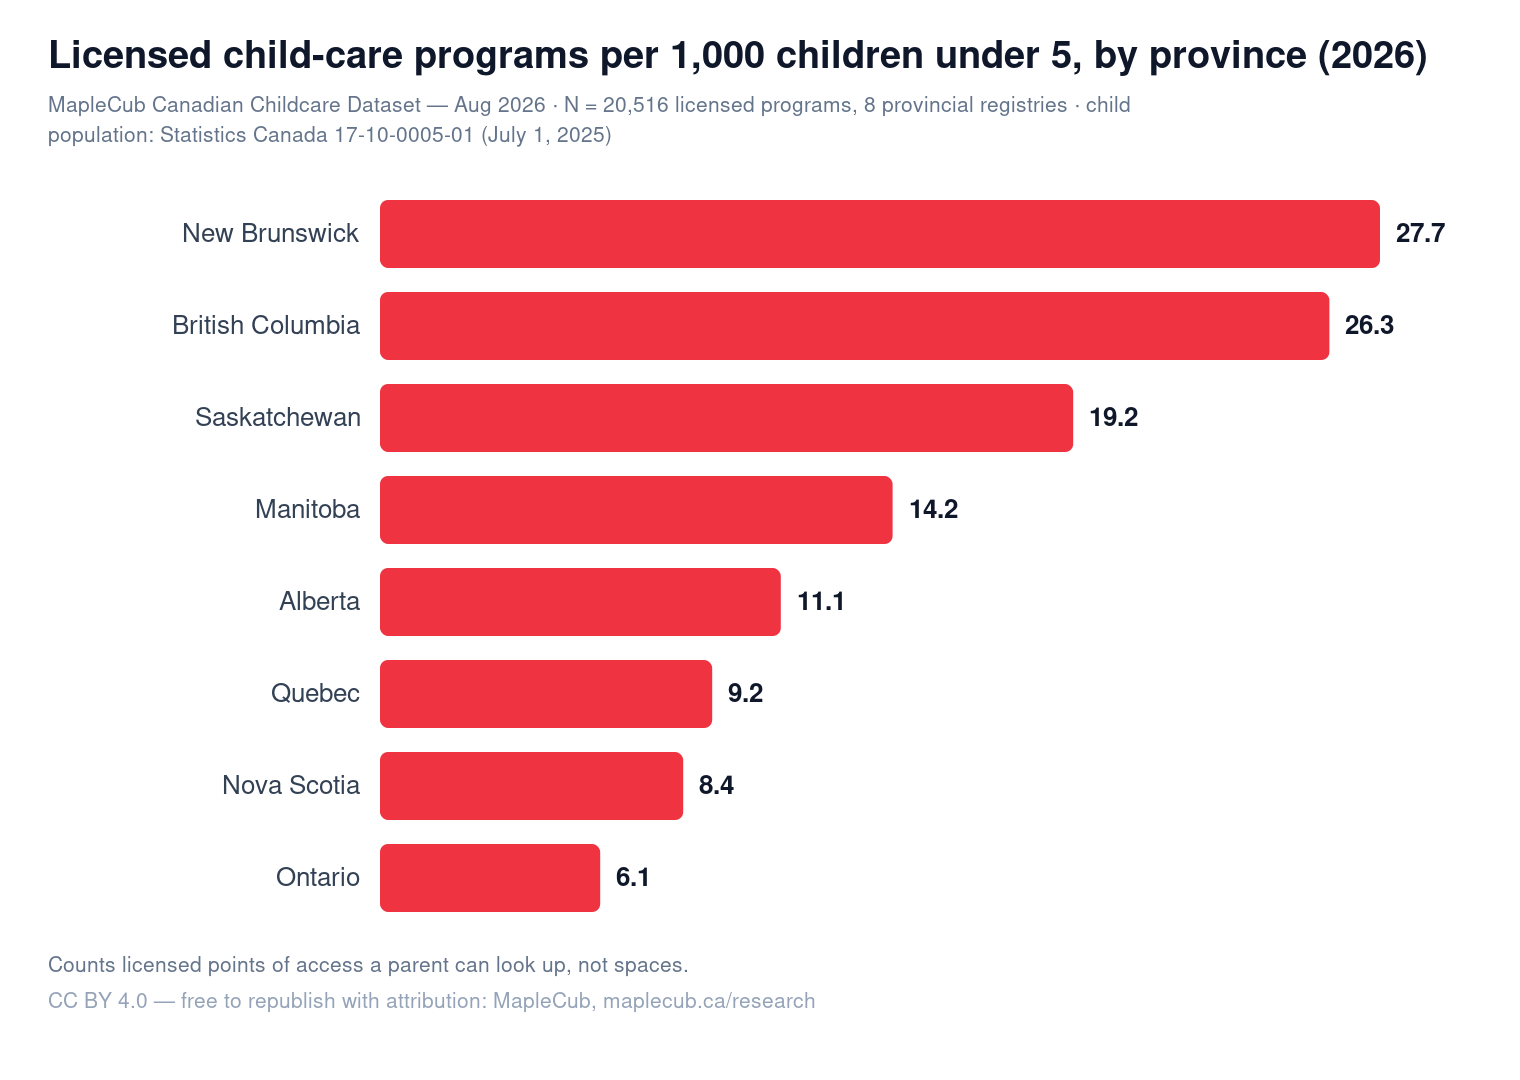
Ontario sits at the far end of that range with 6.1; New Brunswick sets the national high at 27.7. Licensed programs per 1,000 children aged 0–4 is the cleanest cross-province supply signal this dataset supports, and it has to be read with the registry differences in mind: some provinces license each family home individually, others license home care through agencies that never appear as separate records.
Source: MapleCub Canadian Childcare Dataset — Aug 2026 · computed 2026-08-10 · N = 20,516 · CSV · child population: Statistics Canada, Table 17-10-0005-01 (July 1, 2025 estimates)8
What makes Ontario’s registry different
96.2% of Ontario’s 4,374 licensed programs are centres. Only 165 records are home child care, not because Ontario has little of it, but because it licenses home care through agencies, and a single agency licence can stand behind dozens of homes that never surface as separate rows.
That convention is why Ontario sits last on supply per child: 6.1 programs per 1,000 children aged 0–4, against 27.7 in New Brunswick. Read as spaces, the gap would be a scandal. Read as records, it is a filing rule, and nobody outside the ministry can convert one into the other, because Ontario publishes no licensed capacity either.
Price is where the record thins out most. The CWELCC cap only binds at enrolled centres, and the province’s licensed child-care open data carries licensee, licence number and status, service manager, region and language, and no enrolment field. Ontario is, with New Brunswick, one of only two registries here that record whether a program is French-language; it records nothing about the one figure that decides a family’s bill.
Source: MapleCub Canadian Childcare Dataset — Aug 2026 · computed 2026-08-10 · N = 4,374 · CSV · registry structure and published fields as documented by each province
Where to go from here
Ontario beyond the arithmetic: the programs themselves, and the rules behind them.
- Licensed daycares in Ontario: browse the 4,374 programs themselves, with age, hours and subsidy filters.
- What child care costs in Ontario: the fee rules and subsidy thresholds behind the price line above, with official sources.
- Ontario’s one-option communities: the 271 places with a single licensed program, named.
- $10-a-day: claimed vs. measured: what the registries can and cannot confirm about the price each province advertises.
- The State of Licensed Child Care in Canada, 2026: the national report these figures were computed for.
- Toronto child care in numbers: the city snapshot, 856 licensed programs.
Cite as: MapleCub, “Ontario child care by the numbers, 2026,” 2026-08-10, https://www.maplecub.ca/research/ontario-child-care-data. Released under CC BY 4.0. More open data: MapleCub Data Lab.
Sources
Every external claim in this report (every dollar figure, every inspection count, every rule) is cited to the government page it came from. Each entry records the publisher, the document, and the date we last fetched it. Sources were audited 2026-08-11.
- 1. Government of Ontario, Ministry of Education · Canada-Ontario early learning and child care agreement · fetched 2026-08-11 · https://www.ontario.ca/page/canada-ontario-early-years-and-child-care-agreement
- 2. Employment and Social Development Canada · Canada and Ontario agree to one-year extension of the Canada-wide early learning and child care agreement · fetched 2026-08-11 · https://www.canada.ca/en/employment-social-development/news/2025/12/canada-and-ontario-agree-to-one-year-extension-of-the-canada-wide-early-learning-and-child-care-agreement.html
- 3. Government of Ontario, Ministry of Education · Licensed child care facilities in Ontario · fetched 2026-08-11 · https://data.ontario.ca/dataset/licensed-child-care-facilities-in-ontario
- 4. Government of Ontario, Ministry of Education · Compliance of licensed child care facilities with licensing requirements · fetched 2026-08-11 · https://data.ontario.ca/dataset/compliance-of-licensed-child-care-facilities-with-licensing-requirements
- 5. Government of Ontario, Ministry of Education · Serious incidents in licensed child care facilities · fetched 2026-08-11 · https://data.ontario.ca/dataset/serious-incidents-in-licensed-child-care-facilities
- 6. Government of Ontario, Ministry of Education · Consequences for breaking child care rules · fetched 2026-08-11 · https://www.ontario.ca/page/consequences-breaking-child-care-rules
- 7. Government of Ontario, Ministry of Education · Ontario's Early Years and Child Care Annual Report 2025 · fetched 2026-08-11 · https://www.ontario.ca/page/ontarios-early-years-and-child-care-annual-report-2025
- 8. Statistics Canada · Table 17-10-0005-01 Population estimates on July 1, by age and gender · fetched 2026-08-11 · https://www150.statcan.gc.ca/t1/tbl1/en/tv.action?pid=1710000501